Configuration
Before you begin, please note that the Reality Connector must be installed on the Engine to be monitored.

- Click on the Main Menu and navigate to Modules > Hardware Monitor.
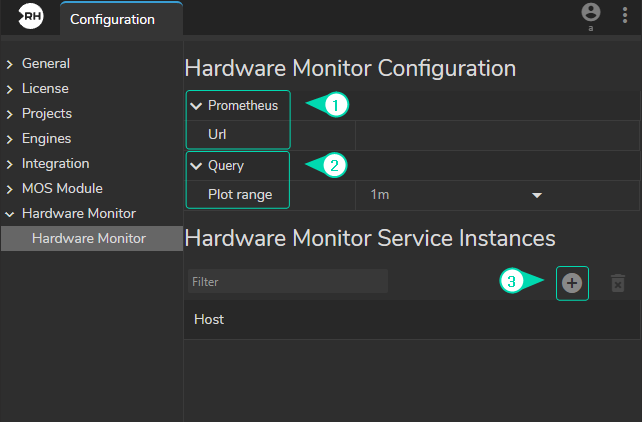
- Expand the Hardware Monitor menu on the left panel.
- Define a Prometheus URL.
Hardware Monitor requires Prometheus event monitoring application. Prometheus is installed and preconfigured during the Reality Hub installation. The Hardware Monitor will use port number 9090 as the default port.
Example:
http://<REALITY HUB SERVER>:9090
- Set a Plot Range Query time.
In this section, you can choose data points over a time range ranging from 1 minute to 12 hours. You also have the flexibility to adjust this range within the Plot Graph.
- Add Hardware Monitor Server Instance.
Hardware Monitor Server Instance refers to an Engine that hosts the Prometheus.
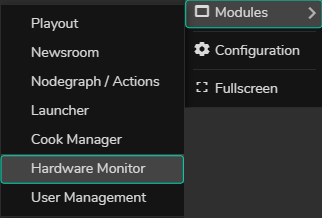
- Click on the Main Menu and navigate to Modules > Hardware Monitor.

- Click on the Engines tab, then click on the Show checkbox.
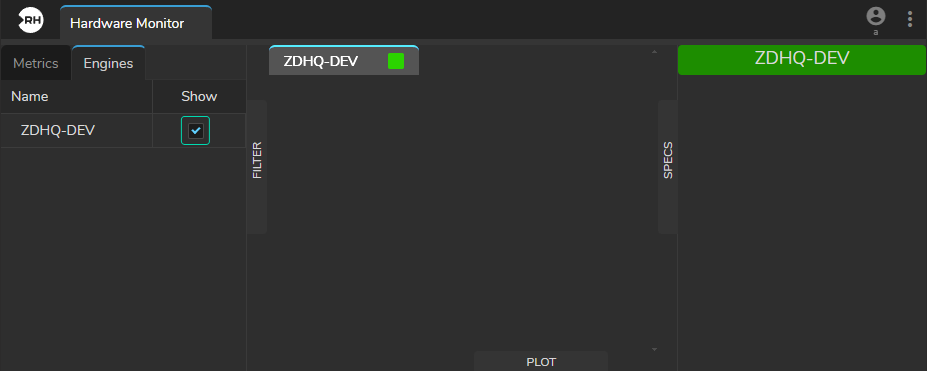
As soon as your Engine is enabled, its hostname also become available in the Metric Display area and Specs section, as shown in the image above.
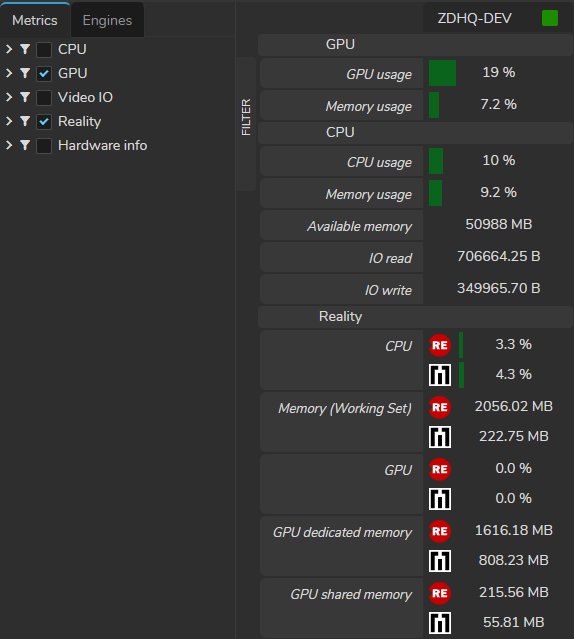
- Navigate to the Metrics section and activate one, several, or all of them according to your preference.