Distortion Visualizer
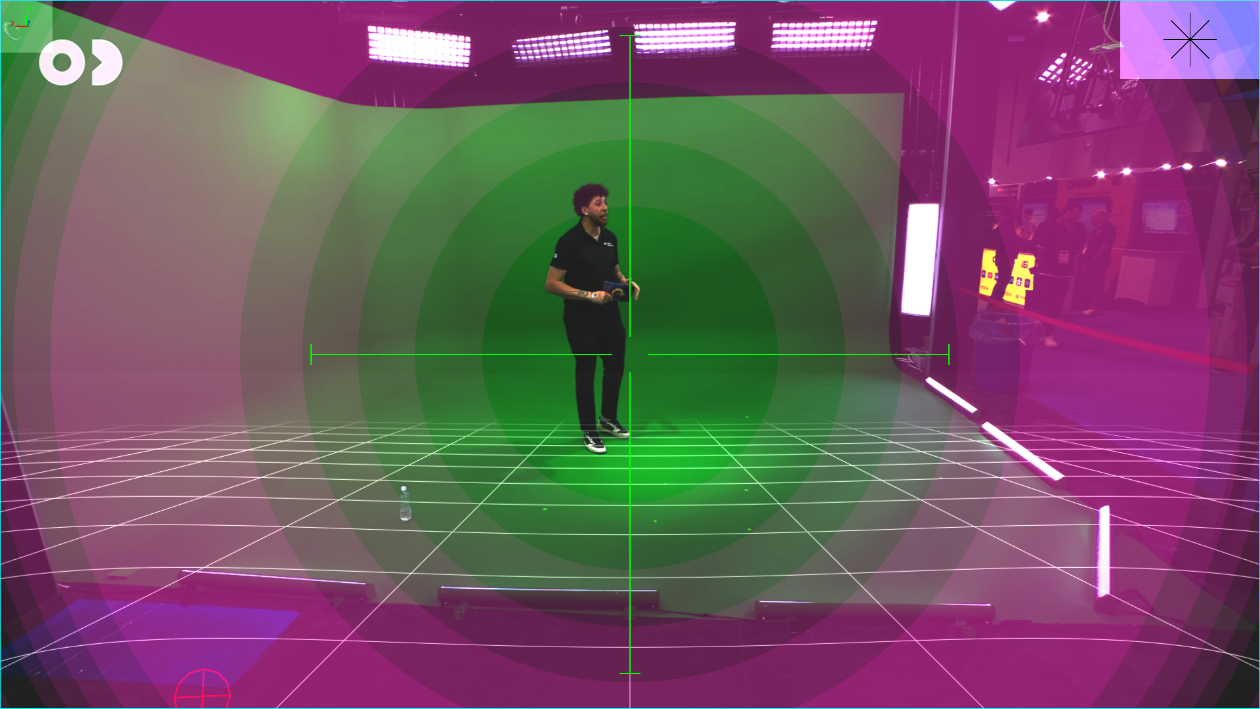
The Distortion Visualizer is a tool that creates a colored overlay to show the effects of radially symmetric lens distortion (K1 and K2). When active, it colors the areas of the image affected by distortion. The intensity of the color corresponds to the magnitude of the distortion, the stronger the color, the greater the distortion.
To reach the Distortion Visualizer navigate to Application Menu > Viewpot > Viewport Settings.
Configuration

Mode
- None: Visualization is off
- K1 Only: The effects of K1 are visualized.
- K2 Only: The effects of K2 are visualized.
- K1 & K2: The combined effects of K1 and K2 are visualized.
Color:
Controls the color of the overlay.
Displacement Delta
The color intensity is based on the number of pixels shifted by K1/K2 lens distortion. Each step of change in the color represents an additional radial pixel distortion of the number of pixels indicated here (HD resolution).
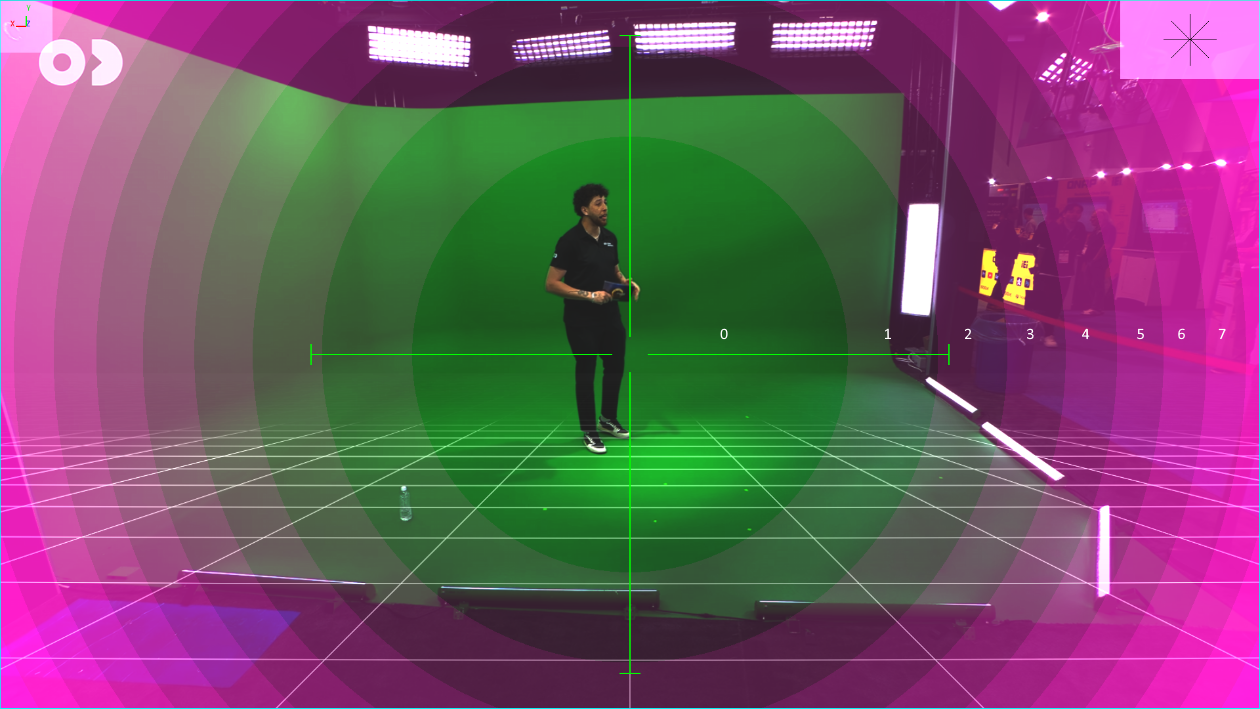
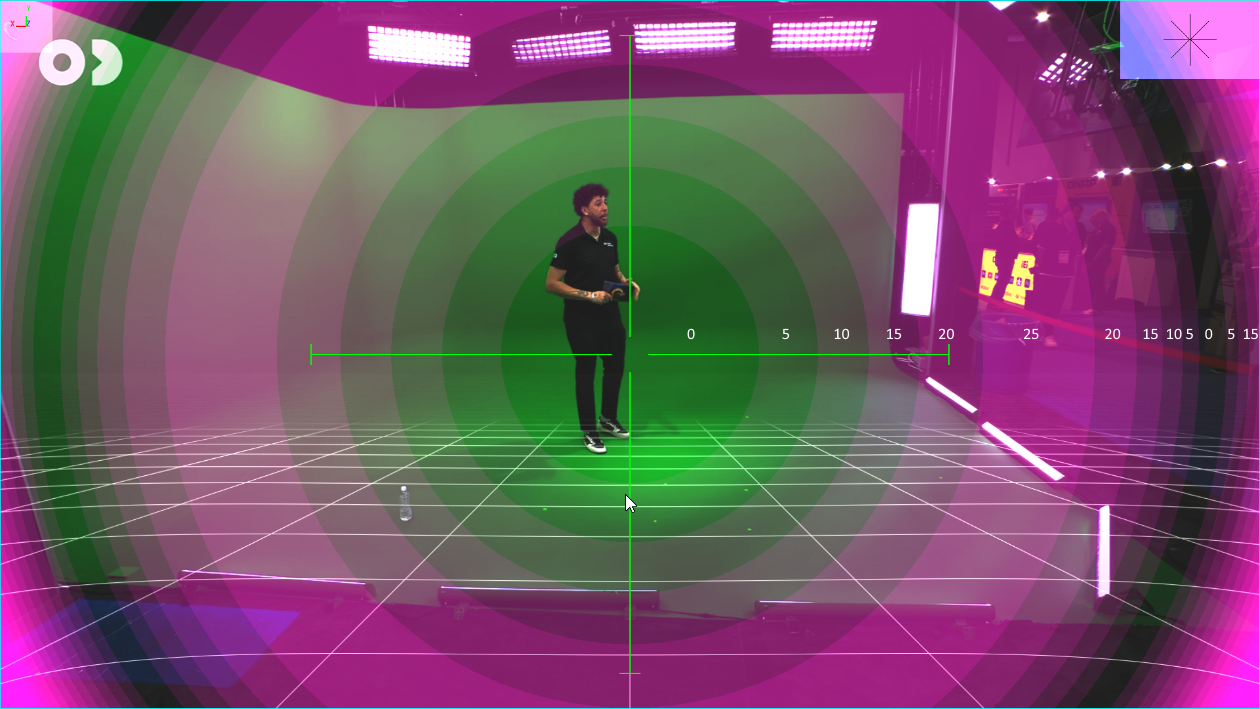
Example
In the following examples, the numbers are added to the image for clarity and are not displayed in the application.
K1 Onlymode,K1=0.010,Displacement Deltais1(each gradient level indicates 1 HD pixel distorsion displacement).
K1 & K2mode,K1=0.150,K2=-0.230, each gradient level is5additional pixels of distorsion displacement. Note that distortion displacement is zero at the center, increases towards the edges, then drops to zero again, then rises and quickly becomes extremely high on the very edges.
- Another example where the distortion is apparent on midway from center to the edge, but is low on the very edge itself.